
Whether you’re prepping for an upcoming pitch or trying to sharpen your public speaking skills, there’s a lot of information about giving presentations. How do you keep your audience engaged? What if you’re nervous about speaking? What colors should you use?
Below are 15 presentation statistics covering attention, visuals, storytelling, delivery, and the fear of public speaking. Every figure was checked against its original source in September 2026, and the handful that no longer hold up were replaced with research that does.
The short version
Fifteen statistics is a lot to hold at once, so here is what each stretch of this page is good for.
Designing the slides. Stats 1, 3, 6, 7, 8, and 9 all bear on one decision, which is how much to put on a slide and whether it should be words or a picture. Read these before you build.
Structuring the talk. Stats 2, 4, 5, and 10 cover the shape of the thing. How long to speak, when to tell a story instead of citing a number, and what to hand the audience to do.
Standing up and delivering it. Stats 11, 12, and 13 are about the speaker. Useful the night before, less useful while you are still drafting.
Making the case for better tools. Stats 14 and 15 are the ones to quote when someone asks why presentation software is worth paying for.
1. You have three seconds to capture your audience’s attention.
According to the Glance Test, your audience should be able to understand what you’re showcasing in just three seconds. That’s because you’re likely already up against a few challenges during your presentation, like audience members who are distracted or multitasking. But if you can pass the Glance Test, you’ll be able to convey your message and keep their attention.
2. Audiences that participate outperform audiences that sit still.
This is the best-evidenced finding in the set. A meta-analysis of 225 studies published in the Proceedings of the National Academy of Sciences compared traditional lecturing against active learning, where the audience does something instead of only listening. Exam scores rose about 6% under active learning, and people in traditional lectures were 1.5 times more likely to fail.
The lesson carries straight into a conference room. If you do all the talking, you’re running the format that lost. Build in something for the room to do: ask questions, take a live poll, run a short exercise, leave real time for Q&A.
3. Visual aids help with retention.
Adding a picture to your words is not decoration. It is one of the most replicated findings in learning research, known as the multimedia principle: people learn better from words and pictures together than from words alone.
Words and images travel through separate channels in the brain. Pairing them gives your audience two routes to the same idea instead of one.
Bottom line? Use more visual aids.
4. Storytelling helps with retention, too.
Want to boost your audience’s retention even more? Tell a story. Research from Stanford’s Jennifer Aaker found that stories are remembered up to 22 times more than facts alone. Talk about powerful.
5. Stories move audiences to action.
If the goal of your presentation is to get people to take action, like sign up or donate, then make storytelling the focal point of your presentation. In one study of charitable giving, researchers found that people gave more than twice as much to one named, pictured child as they did to the same appeal framed in statistics about millions of children. The effect is well enough established to have a name, the identifiable victim effect.
That’s because a story shows how and who your ask would help, while a number only shows scale.
6. Your audience can’t effectively read and listen at the same time.
Presentations can be challenging because you don’t want an awkward silence each time you go to a new slide. But putting the same words on the slide and in your mouth makes the presentation harder to follow. Learning researchers have a name for it, the redundancy effect, and it shows up reliably. Adding on-screen text that duplicates what you are saying lowers how much people take away.
Try to stick to one idea per slide, and let the slide carry the image while you carry the words. That way, audiences don’t have so much to take in and can still effectively listen to what you have to say.
7. Pictures are more effective than words.
It’s called the Picture Superiority Effect, which is exactly how it sounds. Researchers discovered that when ideas are presented in graphs or pictures, they’re easier to remember and comprehend than just words. So, the next time you feel you have a text-heavy slide, try to show it through a picture or graphic instead!
8. Audiences can process pictures and symbols in just ¼ of a second.
If you needed more reason to use more pictures and visual aids, consider this: It only takes ¼ of a second for our brains to attach meaning to a symbol. So, if you want to capture your audience’s attention early on, start there!
9. It takes much longer for audiences to read words.
Reading is slower than looking, and there is a solid number behind it. A meta-analysis of 190 studies covering 18,573 people put the average adult silent reading rate for non-fiction at 238 words per minute. At that pace, a 20 to 25 word block of slide text takes five to six seconds to get through.
Compare that to the quarter second a symbol needs and the case for cutting text makes itself. Every extra line on a slide is time your audience spends reading instead of listening.
10. The ideal presentation length is 18 minutes.
Ever wonder why TED Talks are limited to just 18 minutes? Because, according to its curator, Chris Anderson, it’s the perfect amount of time to:
- Hold on to the audience’s attention
- Be taken seriously
- Say something that matters
What’s even more impressive: Anderson’s theory is backed by neuroscience. If you want a rule for the slides rather than the clock, the 10/20/30 rule is the one most often paired with it.
While these first 10 presentation statistics are designed to help you put on your best presentation, let’s actually talk about making it through your presentation. Nervous? Here are a few public speaking statistics.
11. More than three quarters of the population fears public speaking.
Next to America’s biggest phobias, like bugs and heights, is public speaking. The figure most often quoted in the clinical literature is 77% of the general population, and the fear has its own term, glossophobia.
It is not a trivial thing to feel. At its most severe it is diagnosed as social anxiety disorder, and researchers link it to lower educational achievement and occupational impairment.
The bottom line, though, is that if you felt alone in this boat, you certainly are not. That fear is driven largely by adrenaline, and there are tons of ways to help overcome it.
12. Your audience forms an impression in 100 milliseconds.
While that fact may sound harsh, it’s not all bad. Princeton researchers showed people unfamiliar faces for just 100 milliseconds and asked them to rate traits like competence and trustworthiness. Those snap judgments matched the judgments people made with unlimited time, and longer looks did not change them.
Why is this important? The impression is set before your first sentence lands.
What you can still shape is everything after it, and that part responds to practice. Related work on charisma finds that brief clips of someone speaking predict how people go on to rate them as a leader.
13. ‘Power posing’ can make you feel more confident.
Straight back, hands on your hips, open arms. These positions are all considered ‘power posing’, and the research on them is worth knowing in full. The original hormonal claims did not survive replication attempts. What did hold up is the part you can actually use: people who hold an expansive posture report feeling more powerful and less anxious.
For a presenter, that is the useful half. Two minutes of standing tall backstage will not change your body chemistry. If it settles your nerves before you walk on, it has done its job.
14. Color coding helps your audience remember what matters.
Ever felt stuck trying to nail down the perfect color scheme for your presentation? Us, too. Here is what the research supports. In a study of color-based teaching methods, color-coding the important segments of a text ranked first among seven techniques for holding attention and improving recall.
Note what that finding does not say. Adding more color is not the point. The widely circulated claim that color lifts comprehension by 73% traces back to color-marketing material, and no published study supports it.
Use color as a system. When one color always means one thing, your audience learns to read your slides faster.
15. AI has become part of how presentation work gets done.
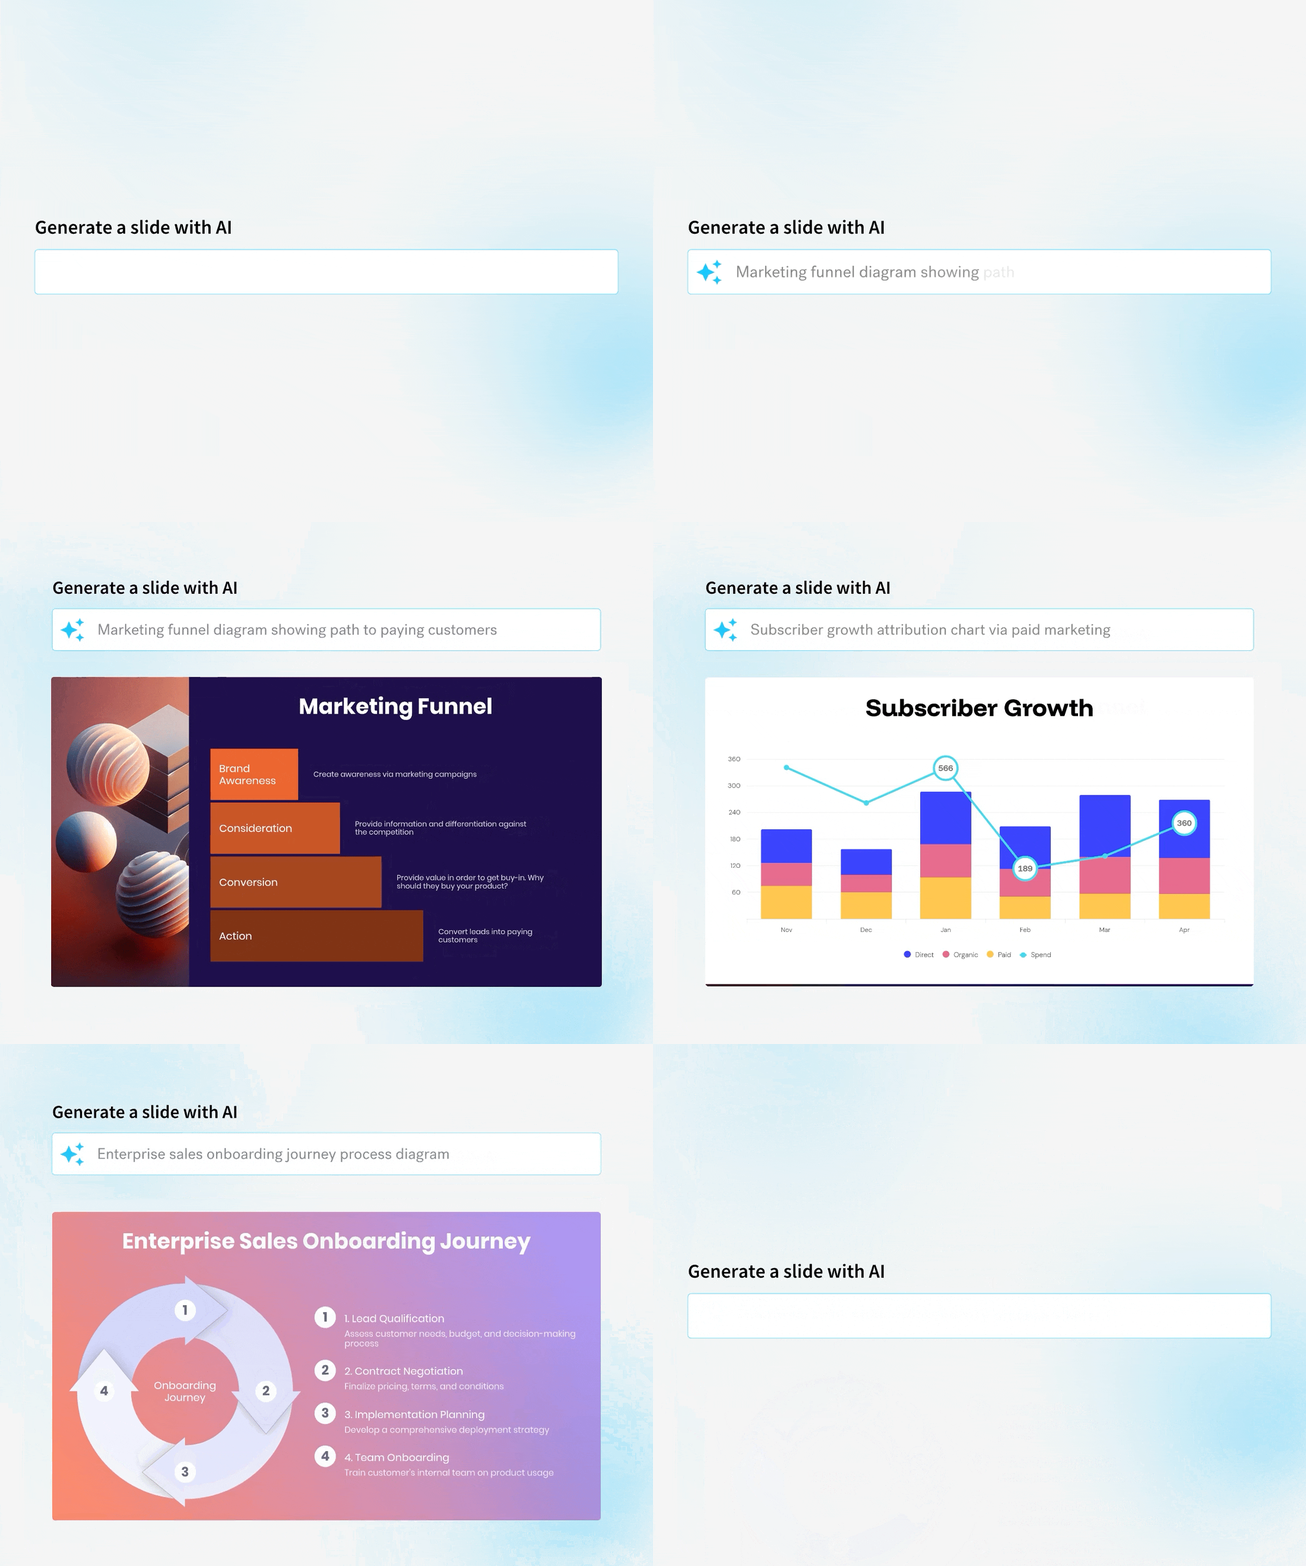
Presentations can be really challenging to put together. Between data and charts and transitions and design, there’s a lot to consider that can potentially make or break your entire presentation.
That workload is what AI is absorbing. Beautiful.ai’s third annual survey of 3,000 American managers found daily AI use in management work climbed from 18% to 34% in a single year, and 72% now reach for it at least weekly. Asked why, 40% named streamlining work and improving efficiency as the main reason.
Building slides sits squarely inside the work those managers are describing. If this sounds like you, you’re in luck!
At Beautiful.ai, we know and understand the challenges of creating your own presentations. That’s why we have hundreds of presentation templates to help you out. Whether you need a quick jump-start or the power and guidance of automated design, we’ve got you covered.
Ready to be proud of what you present? Explore our presentation templates now!


.avif)
.gif)