Gantt chart maker for plans you can present
Gantt chart software is built for managing the plan. Presenting it is an afterthought, and when the status meeting arrives, someone screenshots the chart and pastes it onto a slide. Beautiful.ai skips that step. Your Gantt chart is a Smart Slide, with theme-colored task bars on a calendar or project-time axis, and it is ready to present the moment the plan is drawn.



A gantt chart maker built for the room
Project tools stop at the schedule. Beautiful.ai treats the schedule as part of the story you tell about it, so the chart, the deck, and the discussion stay together.
Task bars that read at a glance
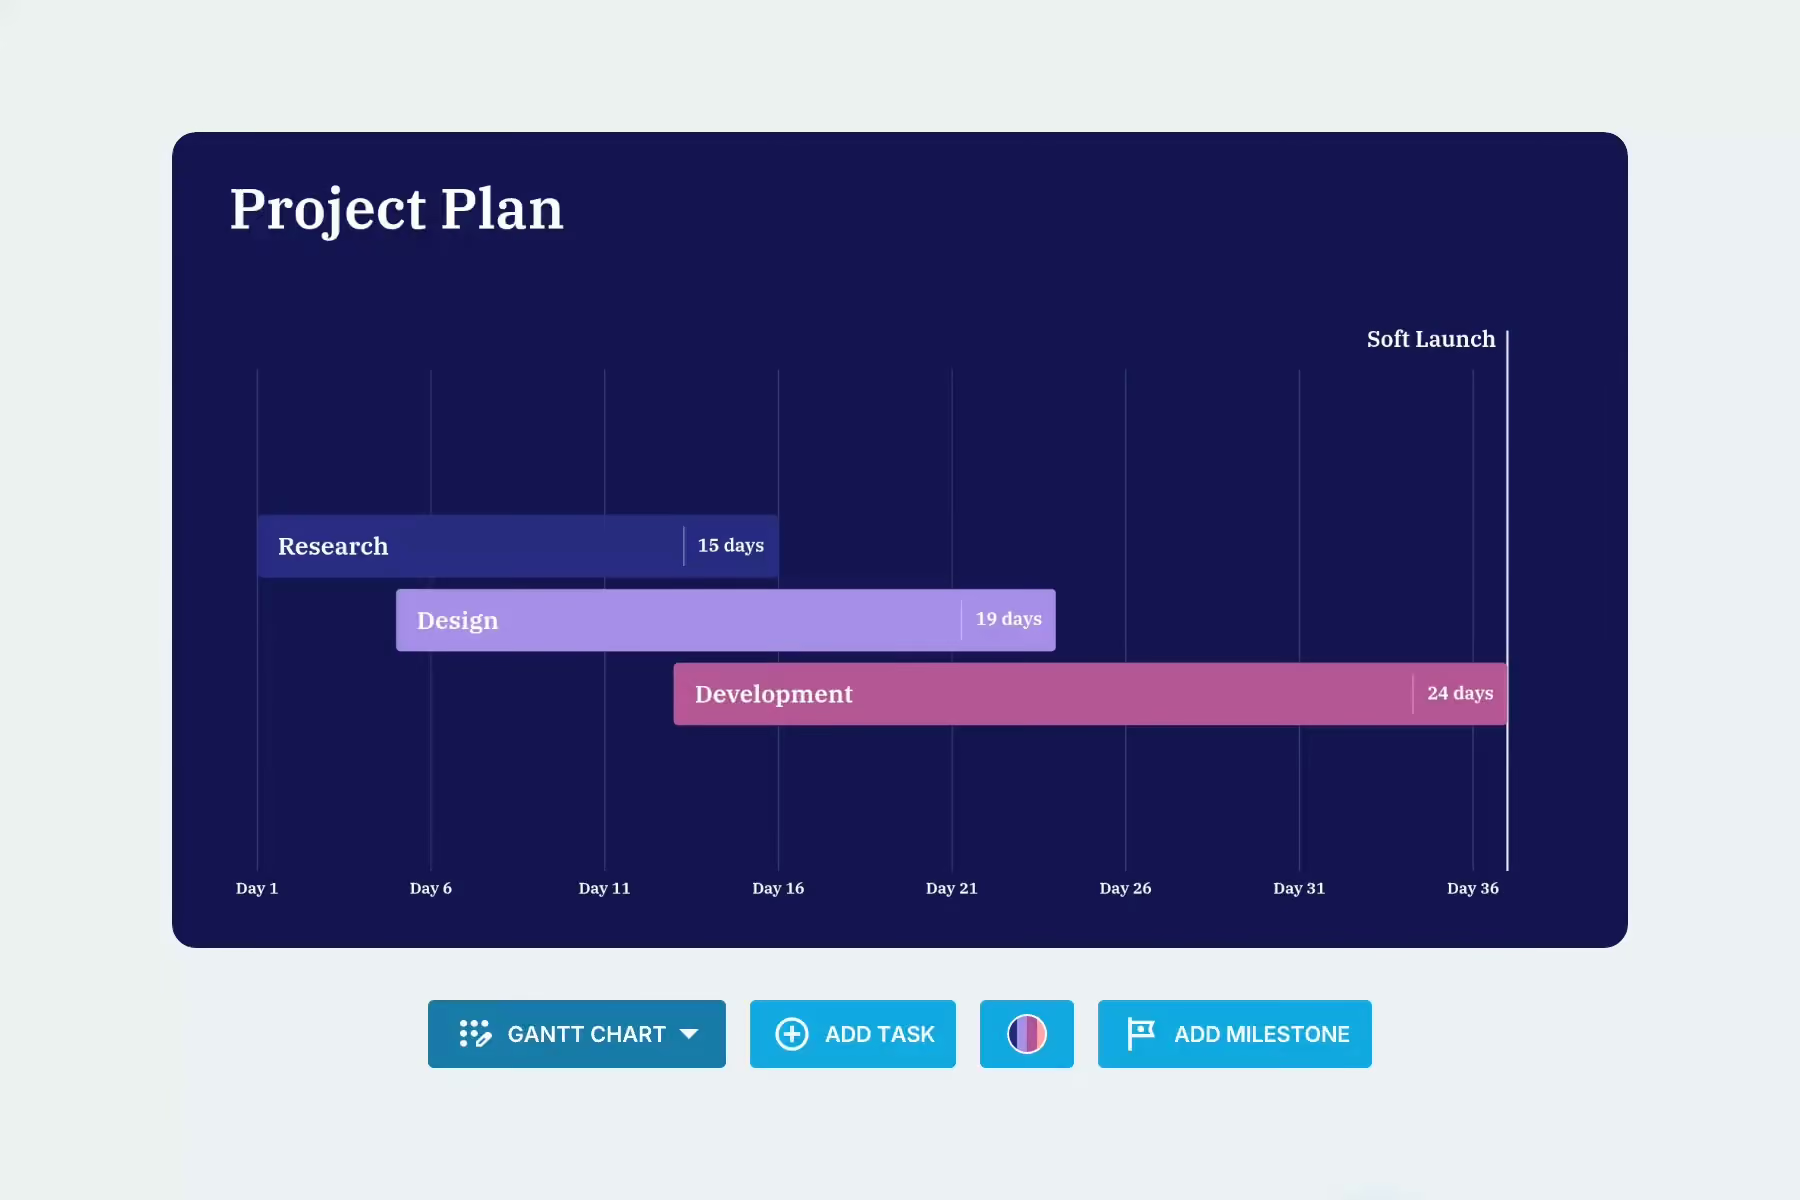
Lay out every task as a colored bar, with colors drawn from your presentation theme. Switch the axis between Calendar Time for fixed dates and Project Time for relative schedules like Week 1 and Week 2, then set the scale to days, weeks, months, or quarters. Show each task's duration or its start and end dates, add an icon or image to the tasks that deserve one, and toggle grid lines when the room needs precision.
Built on slides that design themselves
Smart Slides are pre-built layouts that automatically align and resize as you add and edit content, so the chart stays balanced while the plan changes. Beautiful.ai's data visualization tools go further: chart and data slides can connect data from CSV, Excel, or Sheets with real-time updates, color logic is applied to charts automatically, and you can always edit numbers directly on the slide.
AI drafts the chart, you run the project
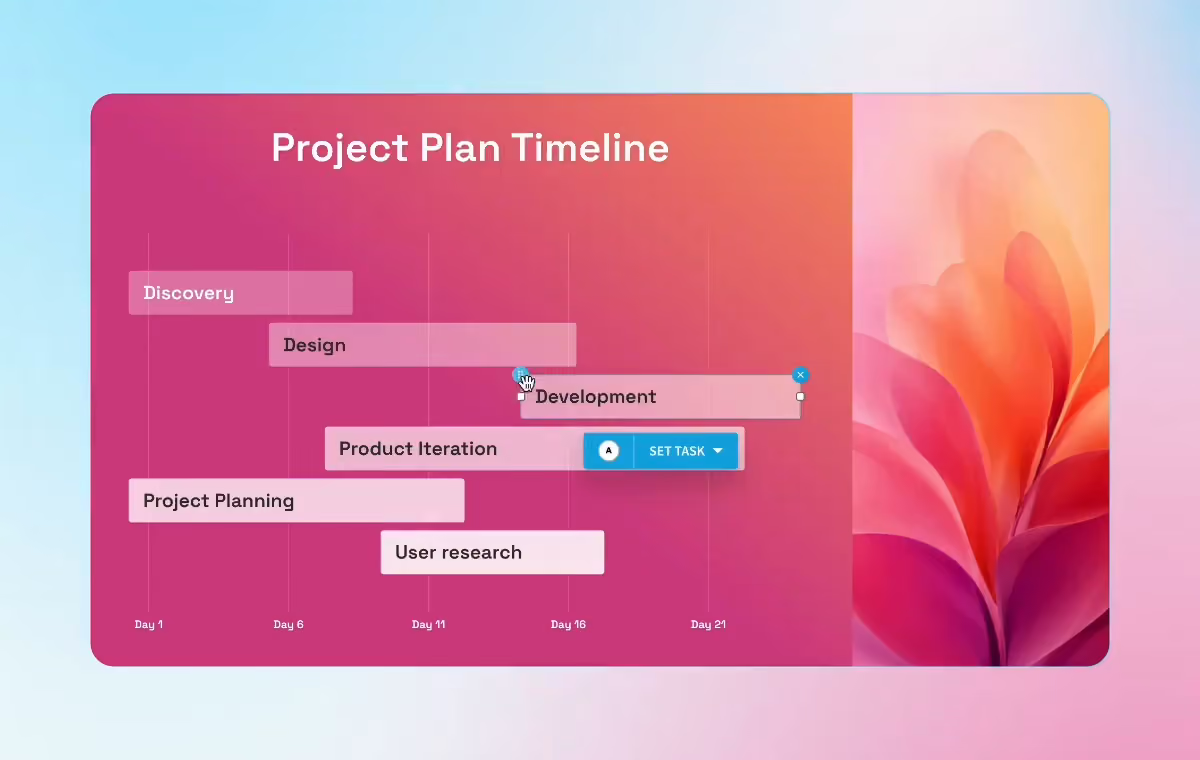
Prompt the AI assistant with the Gantt chart you are looking to create and watch it come together automatically. Upload project documents or data for context and the AI generates a chart that fits your story. It can rewrite task copy in place and summarize project details, like deadlines and deliverables, into digestible chunks. Start from the Gantt Chart template or Create with AI.

How to make a Gantt chart in Beautiful.ai
Three steps from empty slide to a schedule the whole room can follow.

1
Start with the Gantt chart template
Open the Gantt Chart Slide template, or describe your project to Create with AI. Uploading a project document gives the AI the tasks and deadlines it needs to draft the chart for you.
2
Add tasks and dates
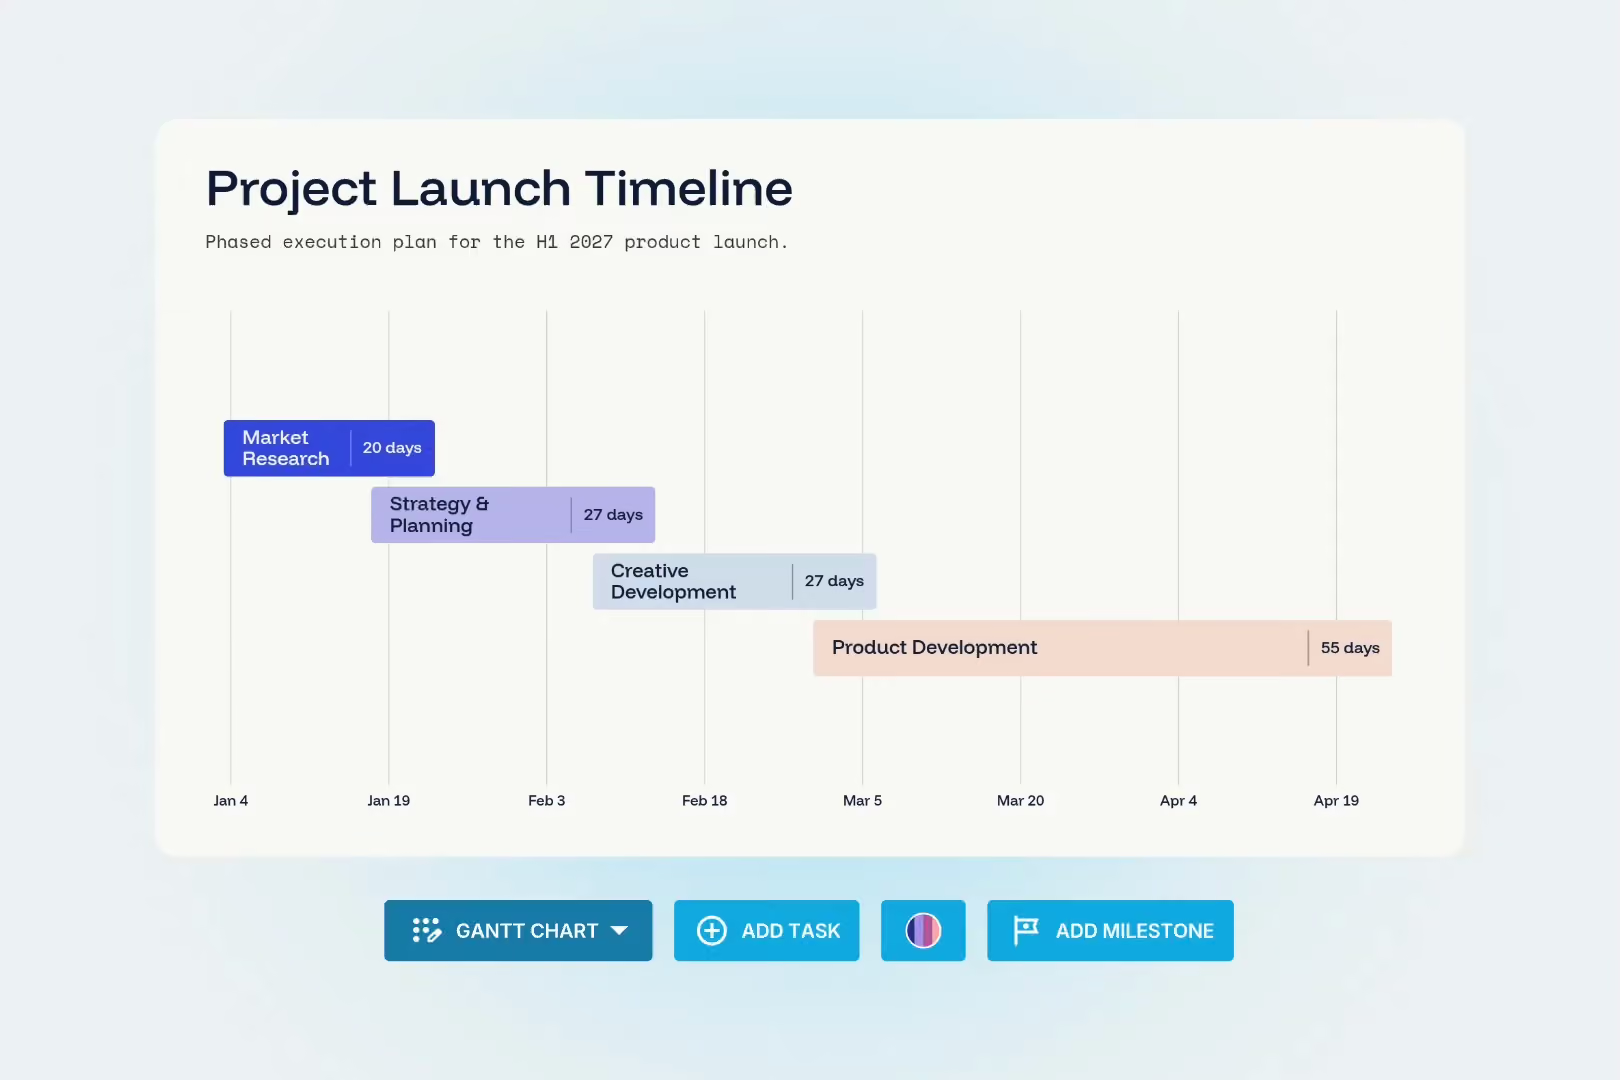
List the tasks that carry the project and give each one its dates, shown as a duration or as start and end dates. Pick Calendar Time when the plan runs on fixed dates, or Project Time when Week 1 and Week 2 are what matter, and set the scale anywhere from days to quarters.
3
Style it, present it, export it
Color the task bars from your theme, add icons to the tasks worth highlighting, and switch grid lines on if the room wants exact reads. Present straight from Beautiful.ai, or export the deck to PowerPoint, Google Slides, or PDF with every element still editable.
Frequently asked questions
A Gantt chart is a visual view of tasks scheduled over time. Invented by Henry Gantt, an American mechanical engineer, it is a type of bar chart that displays a project across two axes: the horizontal axis carries the schedule, the vertical axis lists the tasks, and each task appears as a colored bar positioned where it needs to happen.
Reach for one when the project has a hard deadline, multiple people or teams to coordinate, tasks that must happen in a specific order, or stakeholders who need to see a visual timeline. Gantt charts show up everywhere from construction and manufacturing to marketing, design, software development, and event planning.
Beautiful.ai is free to try: every account starts with a 14-day free trial of the Pro or Team plan. After the trial, paid plans are available for individuals, teams, and enterprise organizations, so you always know exactly what you are getting and when.
A Gantt chart maps a schedule; a kanban board manages flow, focusing on efficiency rather than dates. If the conversation is about when things happen, use the Gantt chart. If it is about what is in progress right now, the Kanban board template is the better fit. The Beautiful.ai blog breaks down the full comparison.
If you need dependency links that reschedule tasks automatically, critical-path calculations, or resource workload management, a dedicated project management tool is the right home for the plan's day-to-day. Beautiful.ai's Gantt chart maker is built for the moment the plan needs an audience. The chart lives on a slide, matches your deck, and presents beautifully.
A well-built Gantt chart shows the project's start and finish dates, every task involved, who is assigned to each task, when each task should start and finish, how long each one should take, and how tasks depend on one another. That single view helps project managers set more accurate deadlines, because the schedule and its interdependencies are visible in one place.
Open the Gantt Chart Slide template, or describe your project to Create with AI, which can draft the chart from an uploaded project document. Give each task its dates as a duration or a start and end date, set the axis to Calendar or Project Time, then export the finished deck to PowerPoint, Google Slides, or PDF.
Yes. Export your deck as a PowerPoint file and every element stays editable, including your presentation notes. Google Slides and PDF downloads are available too, so the chart arrives as a working slide rather than a pasted screenshot.
Yes. Prompt the AI assistant with the type of Gantt chart you need and it comes together automatically. Upload documents or data for context, let AI refine the task copy on the slide, and have it summarize deadlines and deliverables into digestible chunks for the deck around the chart.

Turn your next project plan into a presentation.
Draw the schedule once, keep it on brand, and present it with confidence. Try Beautiful.ai free for 14 days.
