{{template-name}} Template
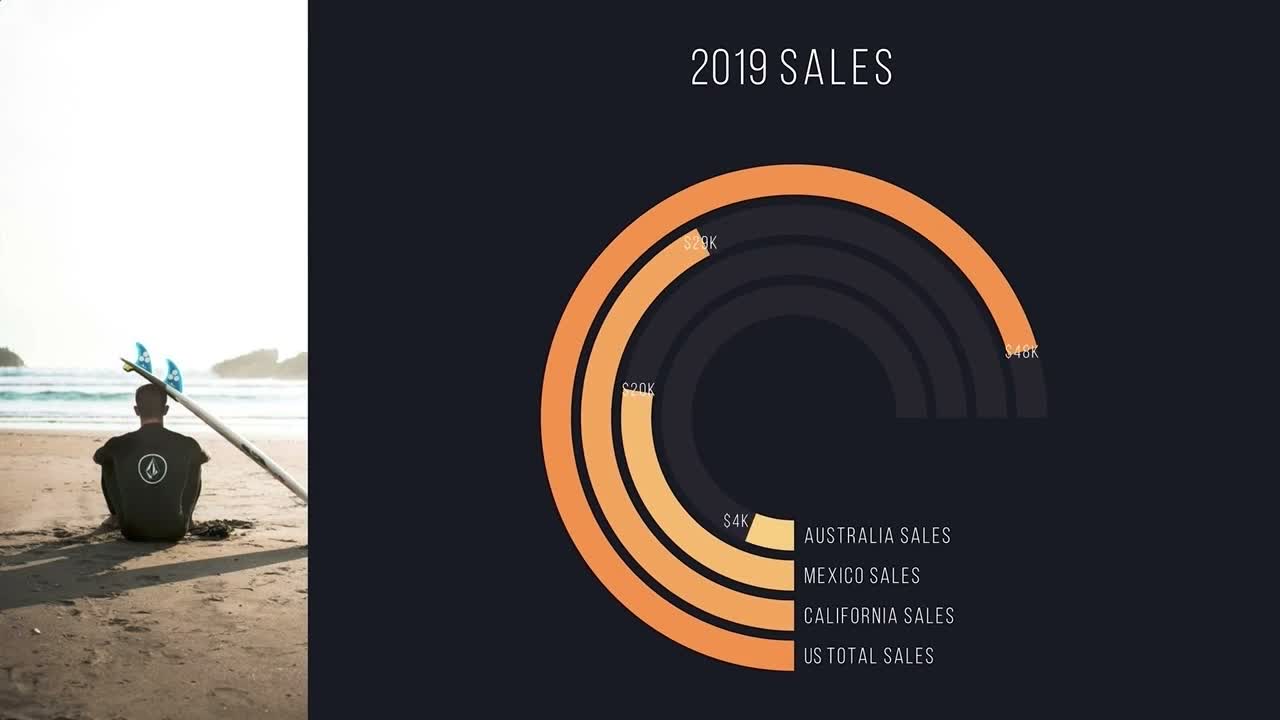
{{template-name}} template styles
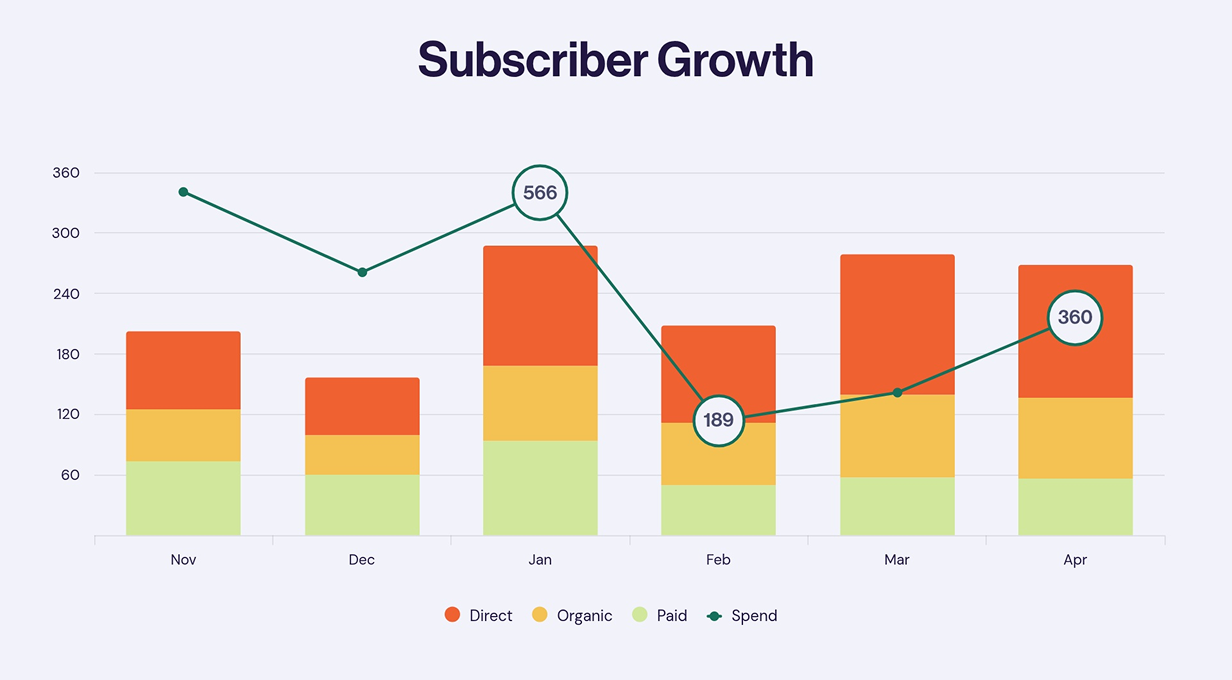
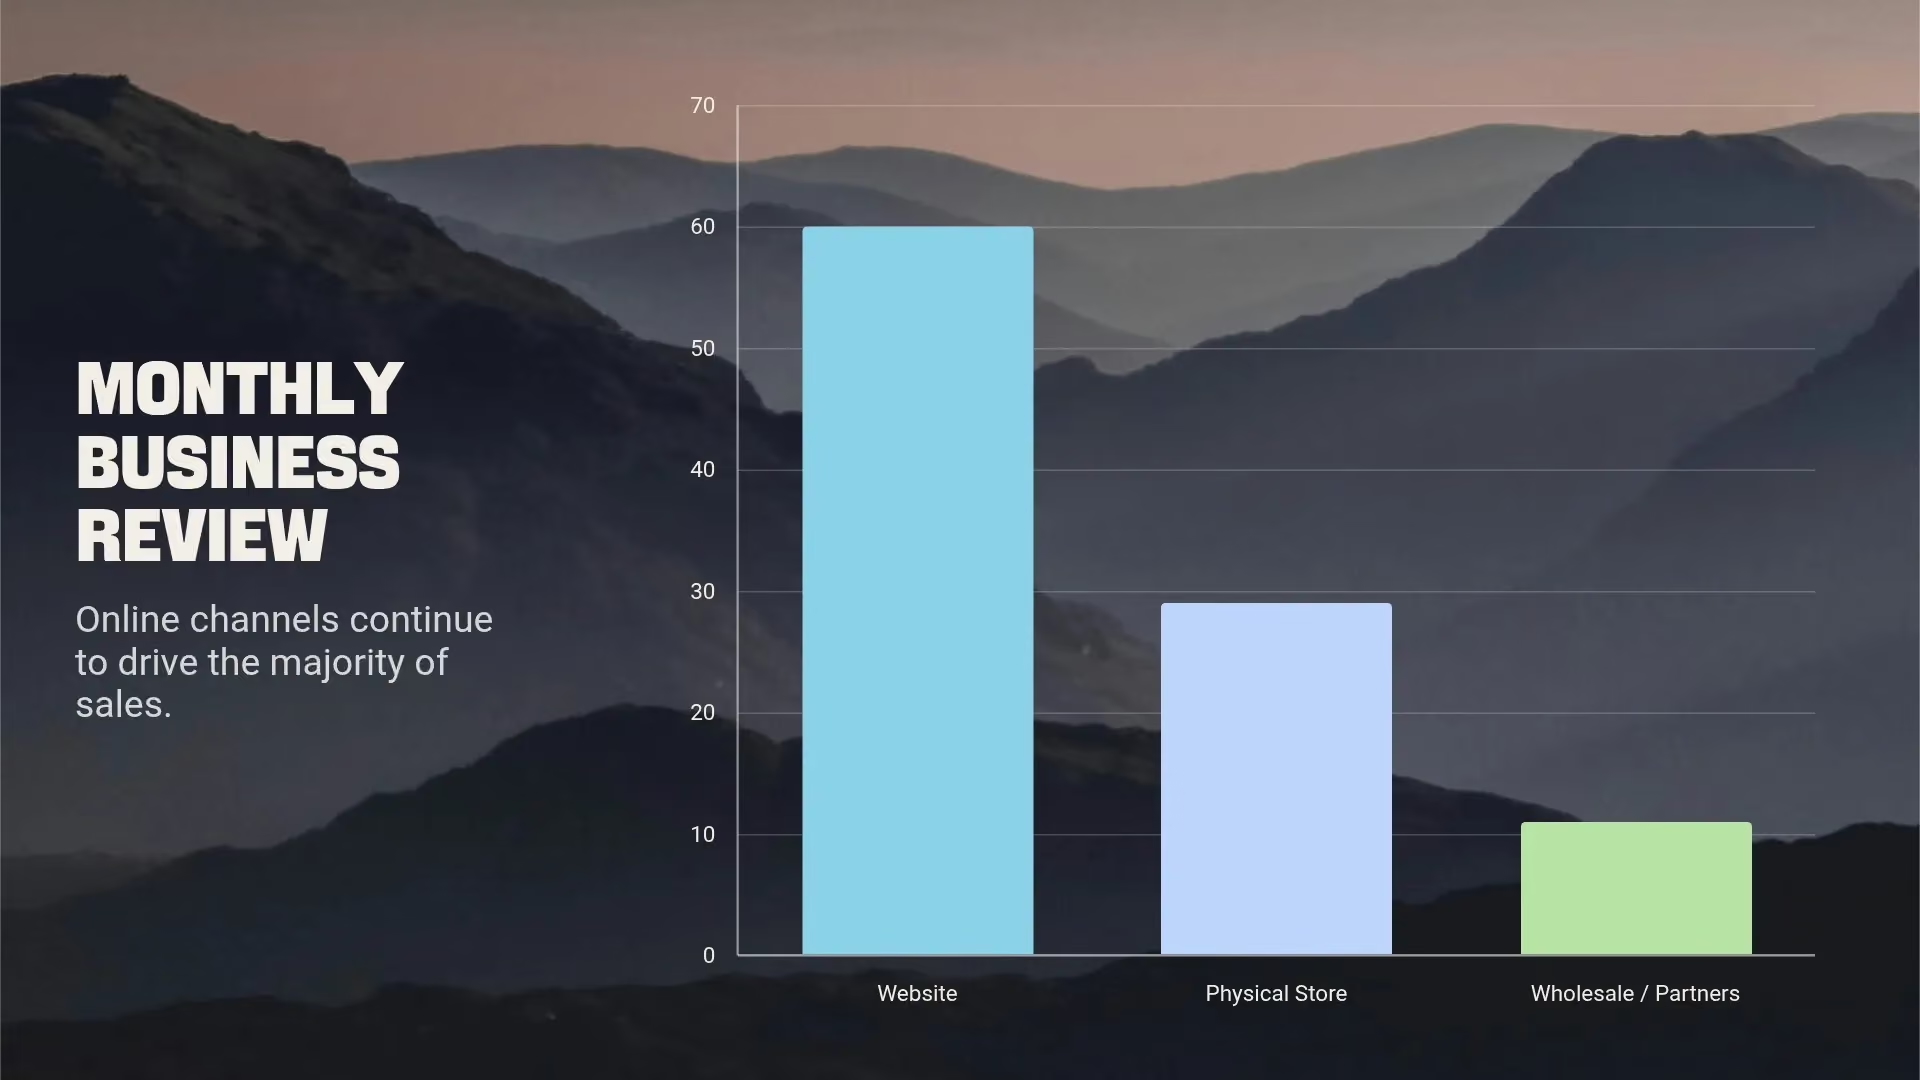
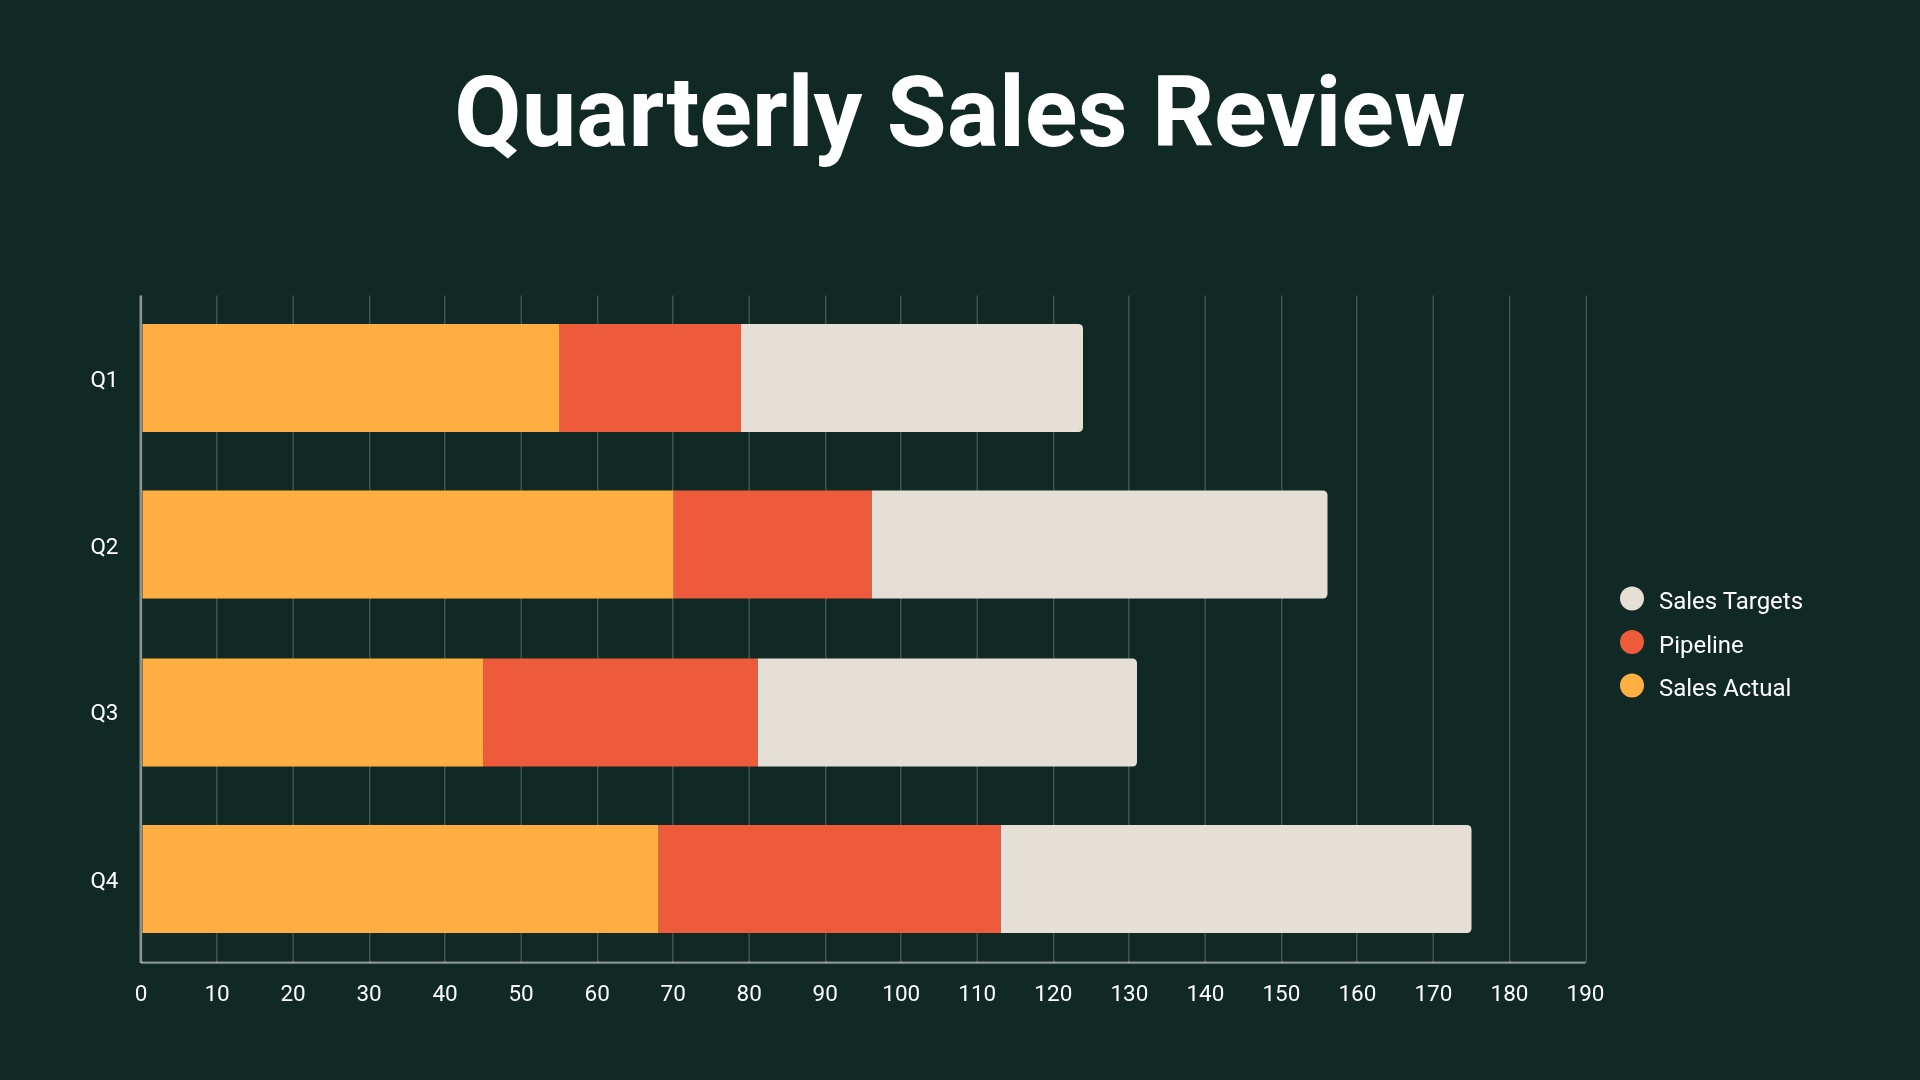
What is a {{template-name}}, and when should you use one?
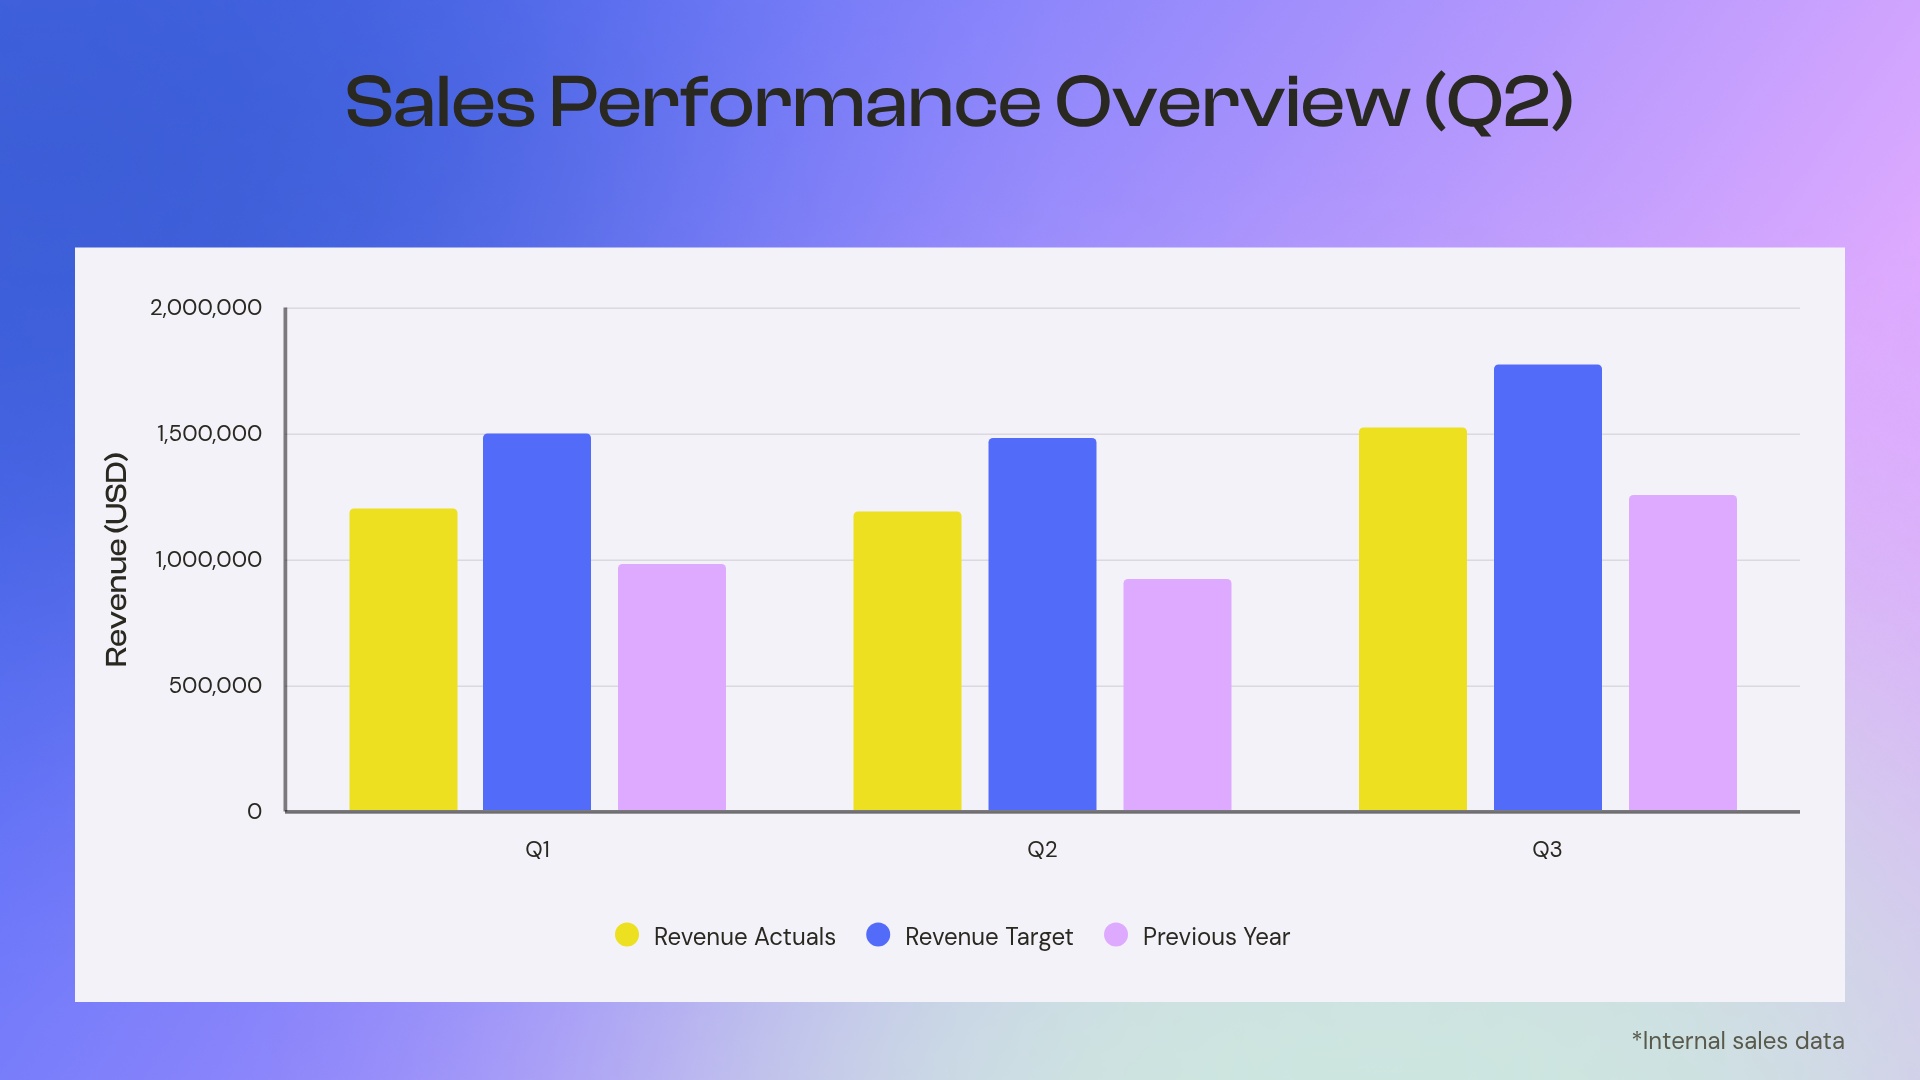
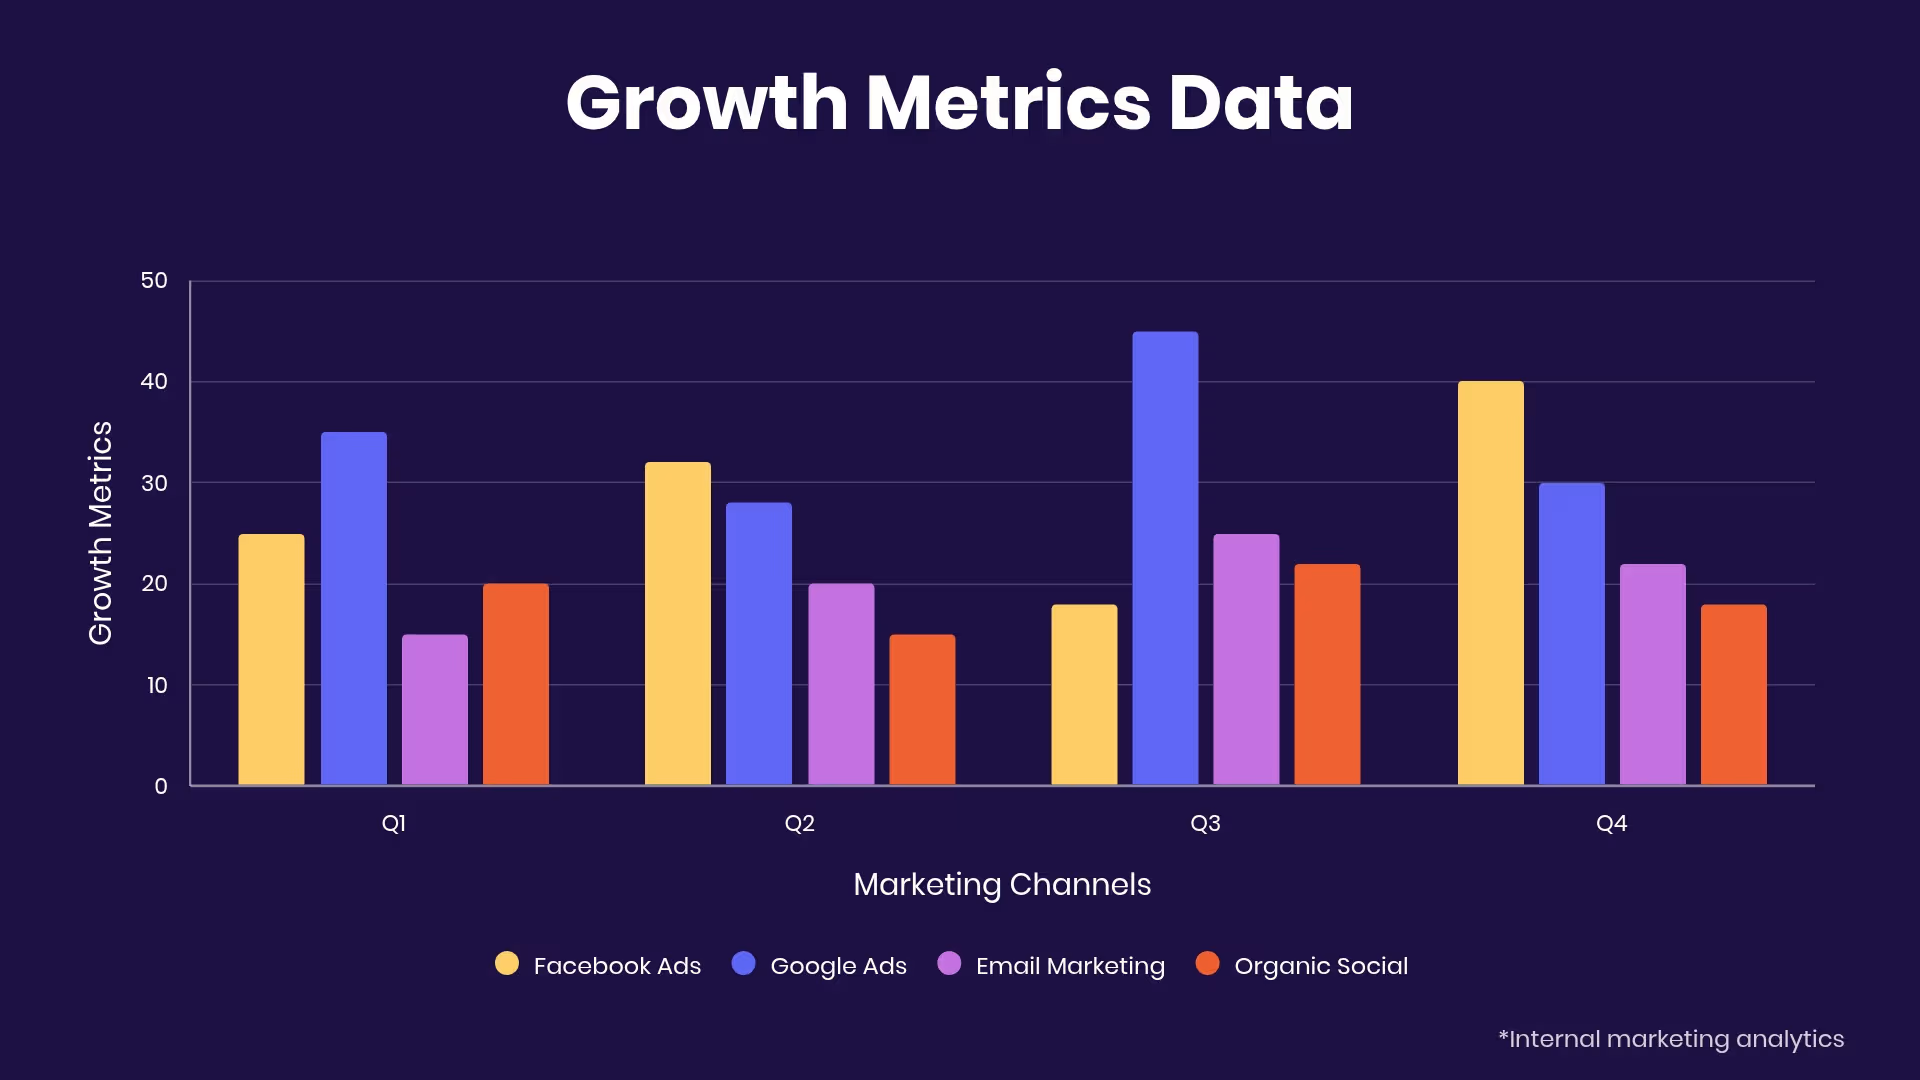
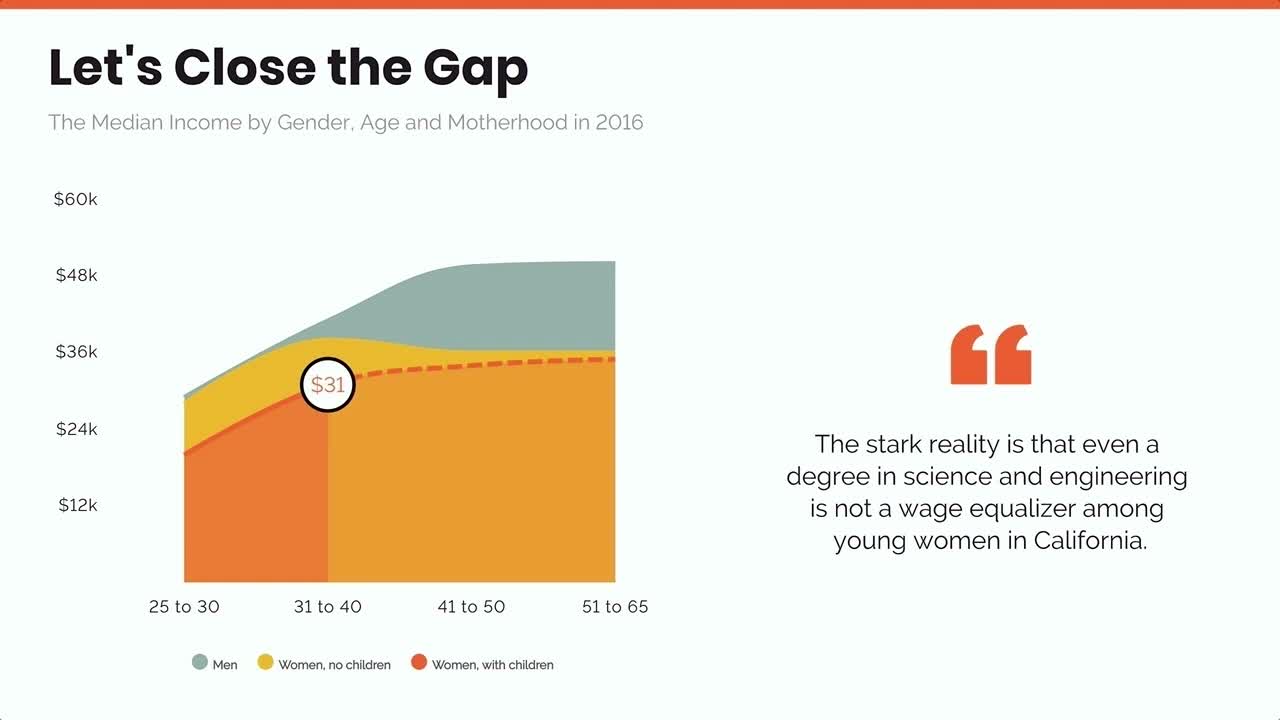
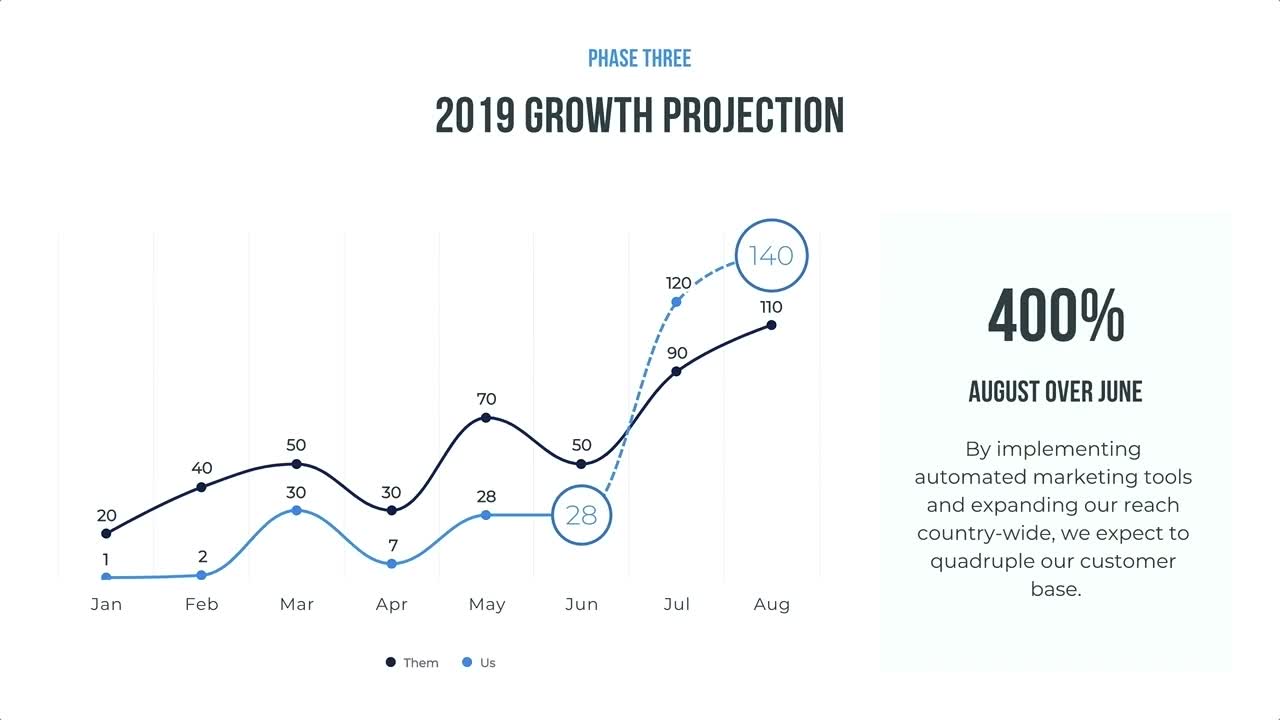
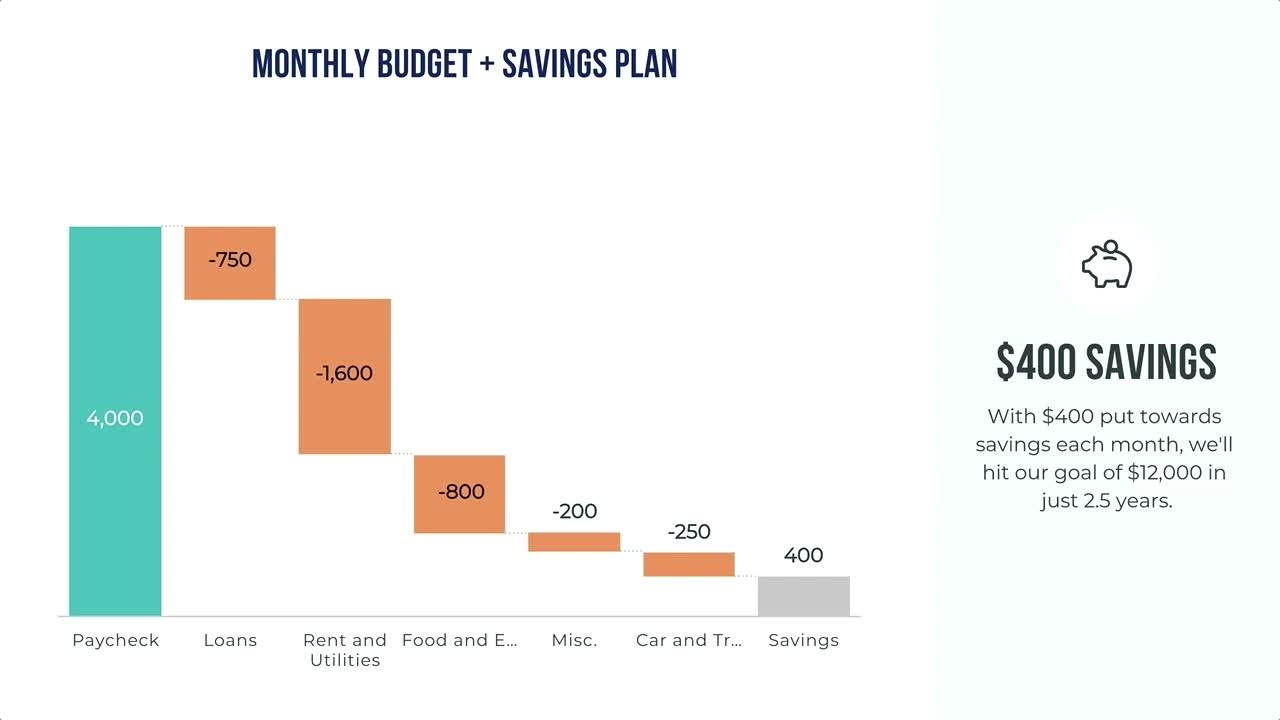
Need to add a little visual interest to your business presentation? A bar graph slide can display your data easily and effectively. Whether you use a vertical bar graph or horizontal bar graph, our bar graph template slides give you options to help simplify and present complex data, ensuring you get your point across.
Customize our bar graph template slides to:
- Compare data over time
- Show relationships between two different groups
- Point out patterns or trends in data
How to use the {{template-name}} Template
Open the template
Click Use this template and the template opens in the Beautiful.ai editor.
Add your data
Enter your categories, values, and axis labels directly in the chart, upload a data file, or describe the data and let AI fill the graph.
Make it yours
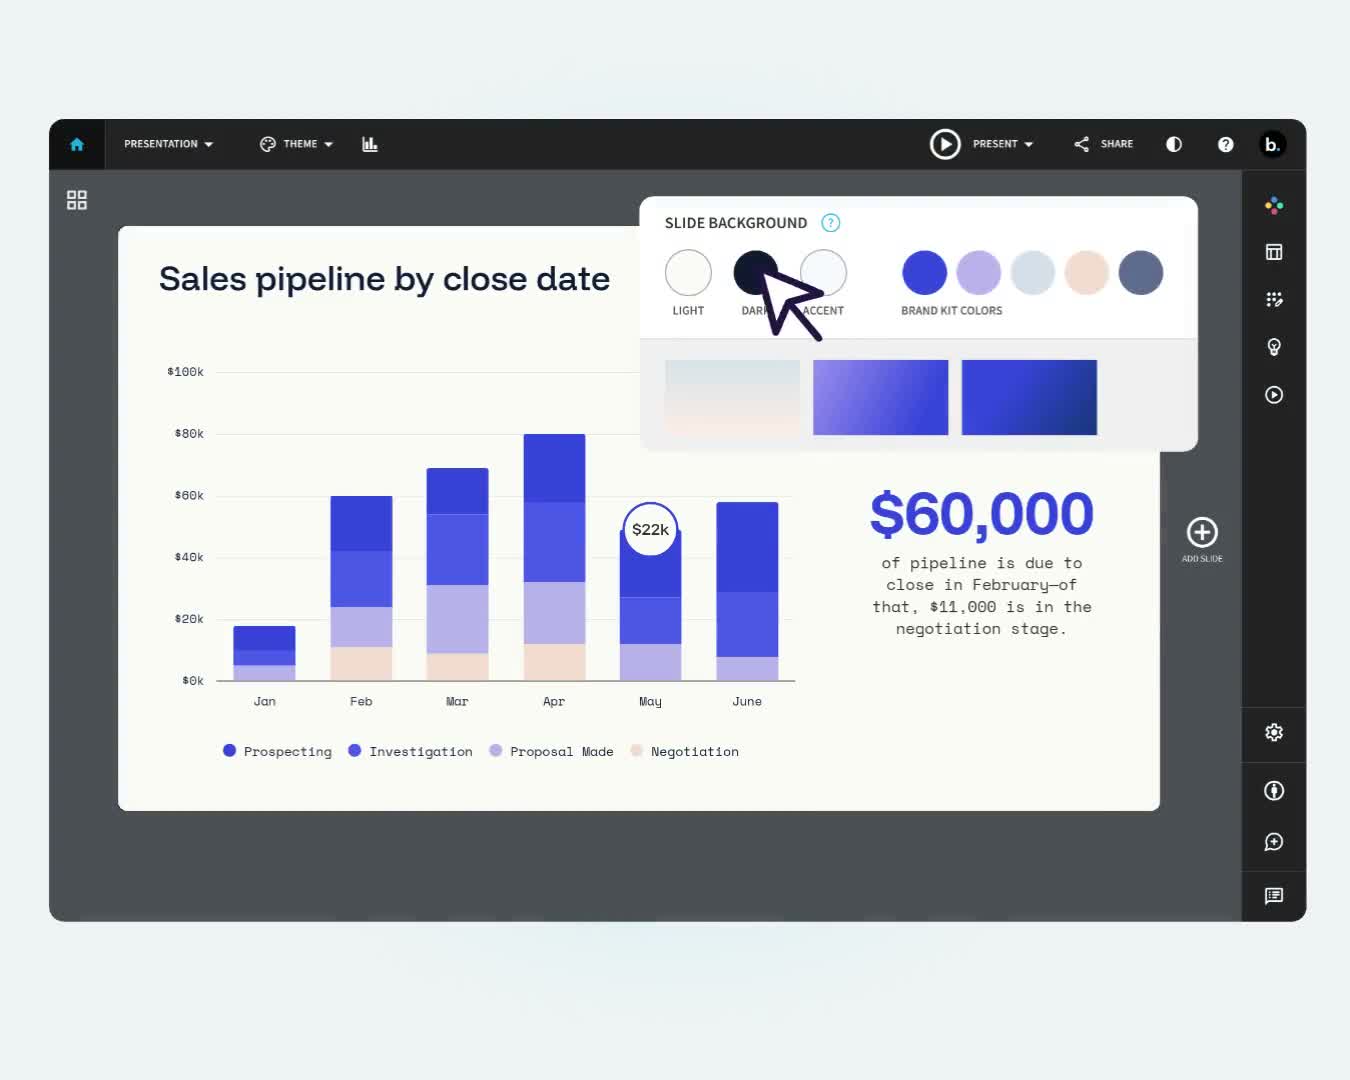
Adjust colors and labels to match your presentation; Smart Slides keep the layout aligned as you edit.
Present or export
Share a live link, present in Beautiful.ai, or export to PowerPoint, Google Slides, or PDF.
Pro Tips for Bar Graph Template Slide
When filling out your bar graph template slide, here are a few things to consider:

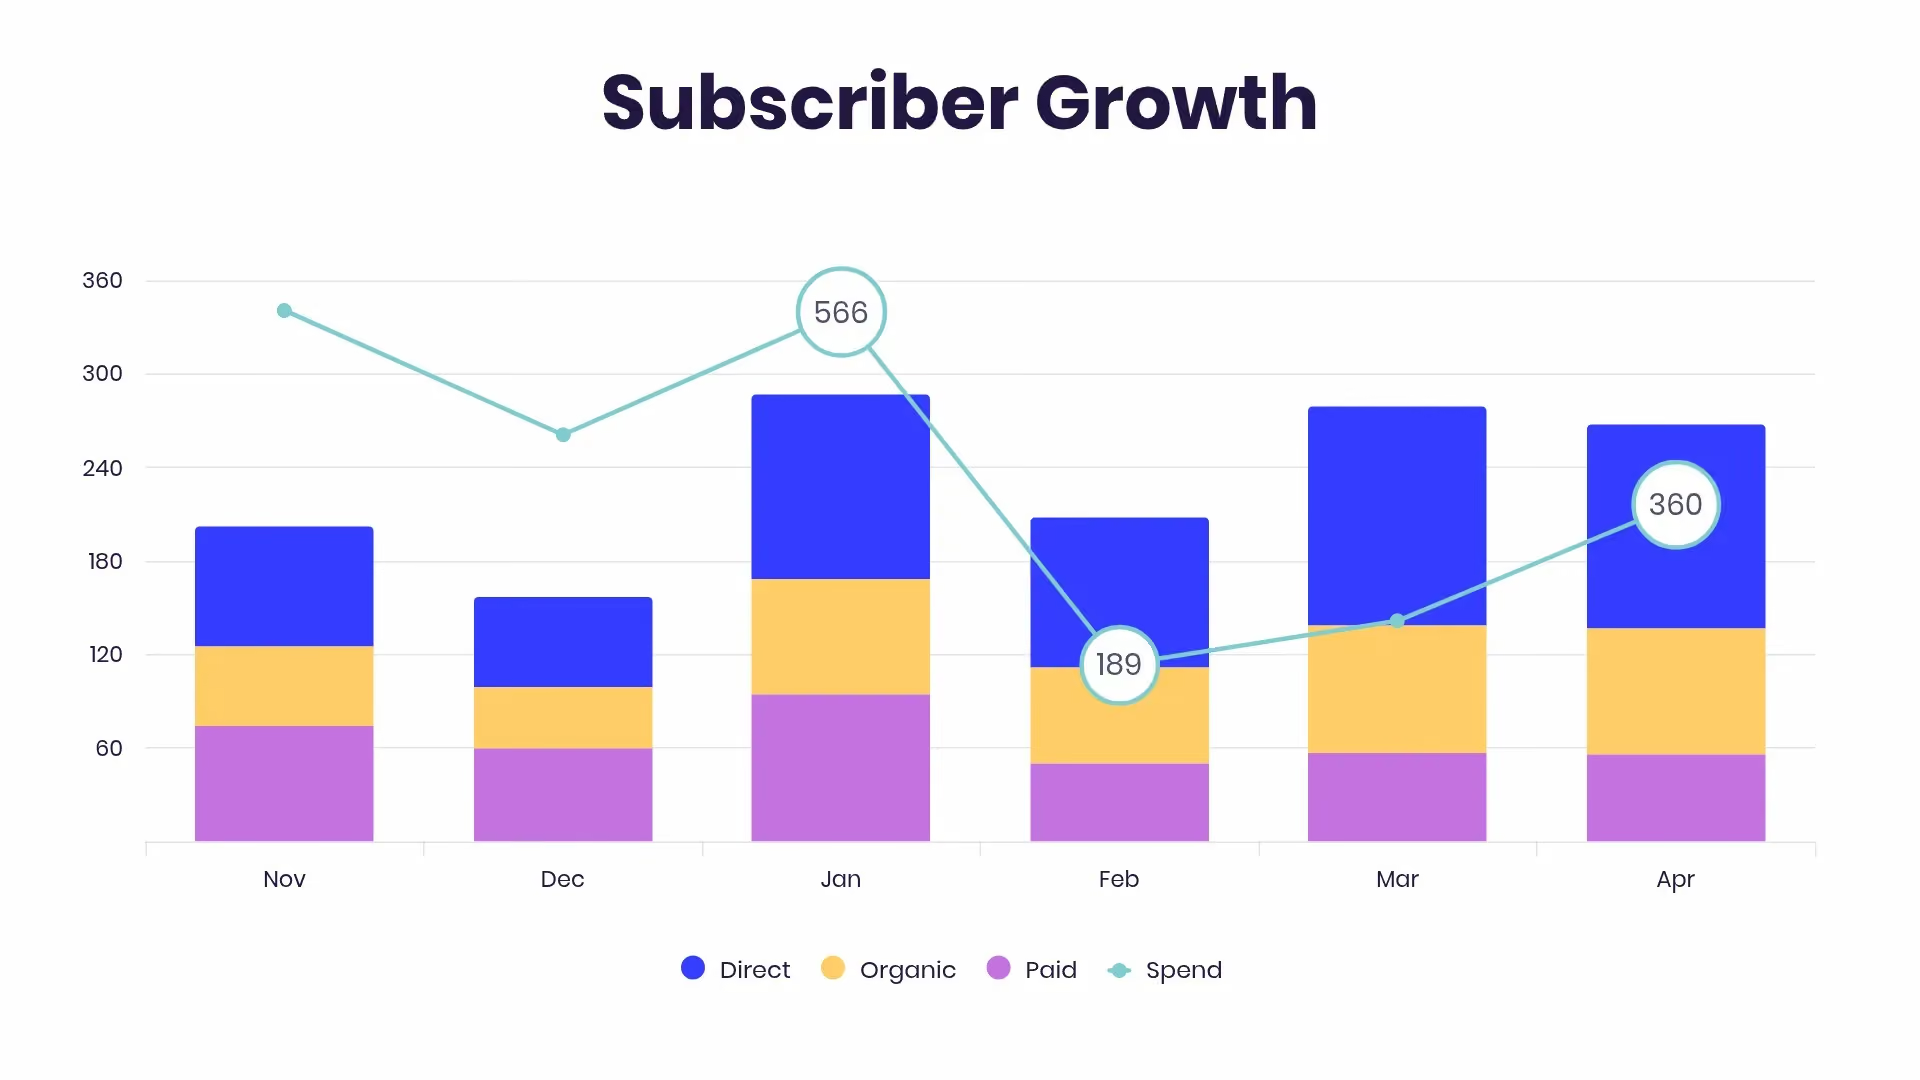
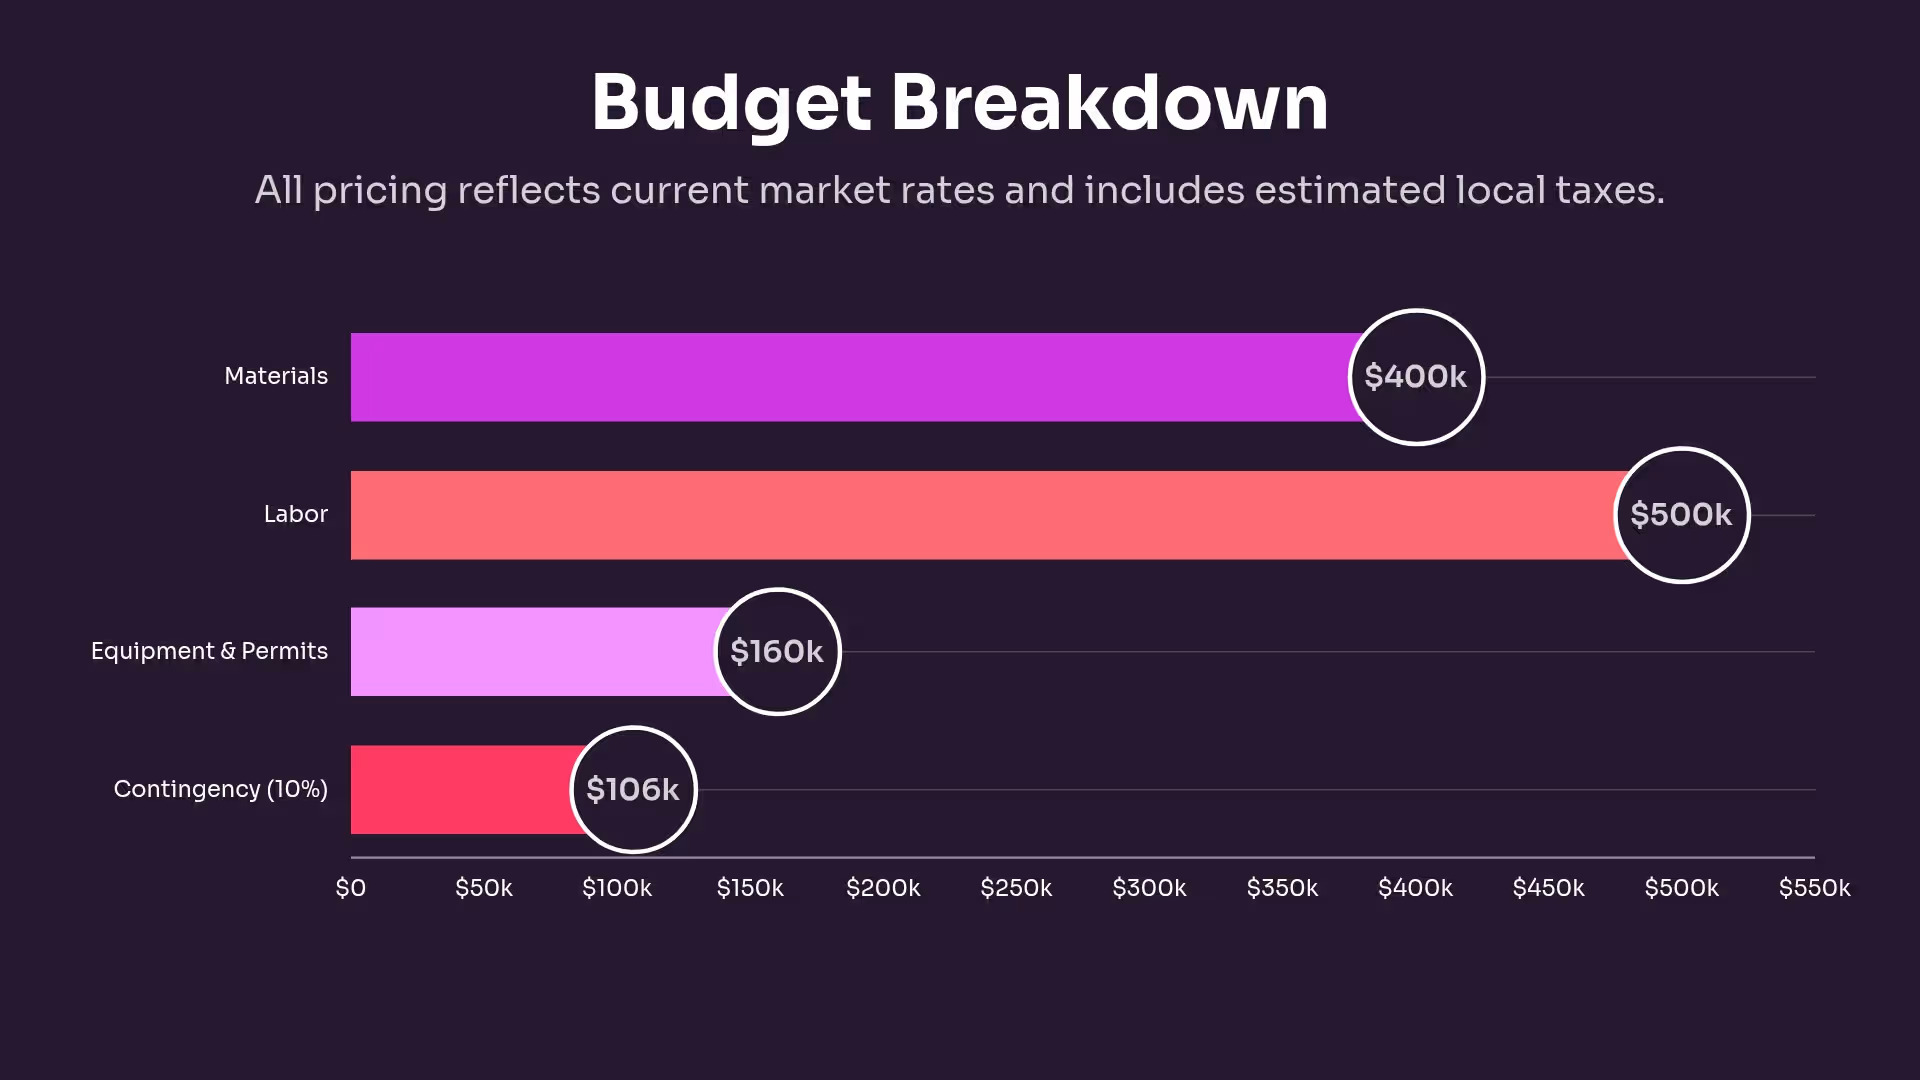
Vertical bar graphs are great for comparing different groups that change over a long period of time. Small or short-term changes may not be as obvious in bar graph form.
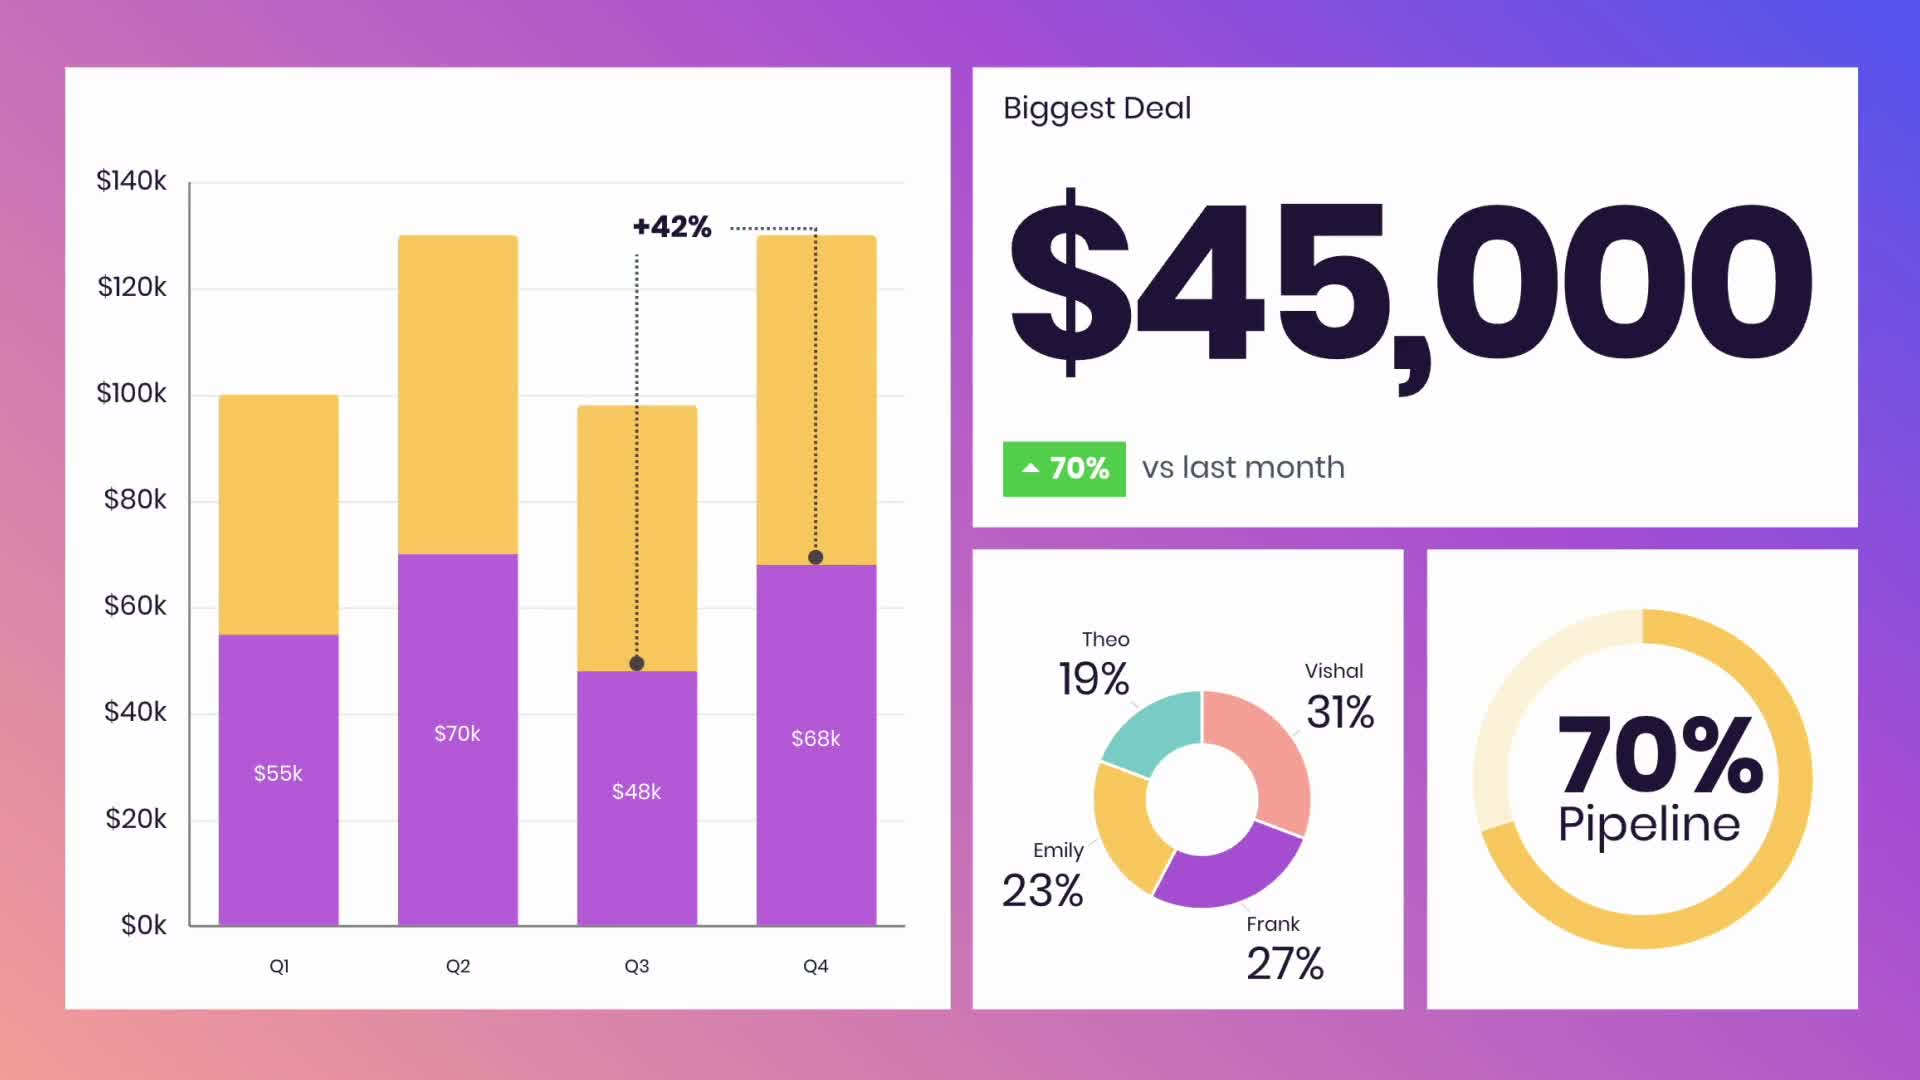
You can use one bar graph template slide to display a lot of information, as long as you differentiate between data sets. Use colors, spacing, and labels to make the differences obvious.
If your data labels are long, a horizontal bar graph may be easier to read and organize than a vertical bar graph.
A vertical bar graph makes more sense when graphing data over time, since the x-axis is usually read from left to right.
Discover AI capabilities for bar graph
With these AI-driven features, you can optimize your bar graph in seconds to create more engaging, effective visuals.
Refine copy on a bar graph slide
Summarize complex data sets
Find trends and relationships in the data
Create a supporting image
Browse more templates

{{template-name}} template FAQ
Lorem ipsum dolor sit amet, consectetur adipiscing elit, sed do eiusmod tempor incididunt ut labore et dolore magna aliqua. Ut enim ad minim veniam, quis nostrud exercitation ullamco laboris nisi ut aliquip ex ea commodo consequat. Duis aute irure dolor in reprehenderit in voluptate velit esse cillum dolore eu fugiat nulla pariatur.
More {{template-category}} templates


AI-powered Smart Slides that do the design for you
Build your next presentation using Smart Slides—the intelligent building blocks behind every Beautiful.ai presentation. Each Smart Slide is customizable, editable with AI, and automatically adapts layout and spacing as your content changes.

“Beautiful.ai helps us quickly create clear and compelling presentations to share our strategy and results. It has been easy to integrate our branding and to pull from the library of materials created by others — building a cohesive and collaborative suite that helps us advance our mission."

"Beautiful.ai increased our efficiency. I mean, 50% sounds crazy, but it's pretty accurate when you consider all of the manual stuff that we used to have to do that Beautiful.ai now does for us."

"What you guys have created is a foolproof way to ensure quality presentations. It's almost just like they have a graphic designer over their shoulder while they're creating their decks."

“For any business owner or entrepreneur where time is of the essence you lose the ability to put those nice touches on presentations, Beautiful.ai does it for you, especially if you aren't creatively gifted!”
Ready-to-use presentation templates for creating full, polished decks.



Pitch Decks



Reports & Reviews



Plans & Strategies

Try it free for 14 days
Start building Beautiful presentations.

